 Ontology-driven Application Meshes Structured Data with Public APIs
Locational information — points of interest/POIs, paths/routes/polylines, or polygons/regions — is common to many physical things in our real world. Because of its pervasiveness, it is important to have flexible and powerful display widgets that can respond to geo-locational data. We have been working for some time to extend our family of semantic components [1] within the open semantic framework (OSF) [2] to encompass just such capabilities. Structured Dynamics is thus pleased to announce that we have now added the sWebMap component, which marries the entire suite of Google Map API capabilities to the structured data management arising from the structWSF Web services framework [3] at the core of OSF.
The sWebMap component is fully in keeping with our design premise of ontology-driven applications, or ODapps [4]. The sWebMap component can itself be embedded in flexible layouts — using Drupal in our examples below — and can be very flexibly themed and configured. sWebMap we believe will rapidly move to the head of the class as the newest member of Structured Dynamics’ open source semantic components.
The absolutely cool thing about sWebMap is it just works. All one needs to do is relate it to a geo-enabled Search structWSF endpoint, and then all of the structured data with geo-locational attributes and its facets and structure becomes automagically available to the mapping widget. From there you can flexible map, display, configure, filter, select and keep those selections persistent and share with others. As new structured data is added to your system, that data too becomes automatically available.
Key Further Links
Though screen shots in the operation of this component are provided below, here are some further links to learn more:
- Live demo of the sWebMap component on the Citizen Dan sandbox
- An explanation of some of the technical details behind the sWebMap component
- sWebMap documentation on the TechWiki, including configuration and styling options
- General background information on ODApps, ontology-driven applications.
sWebMap Overview
There is considerable functionality in the sWebMap widget, not all immediately obvious when you first view it.
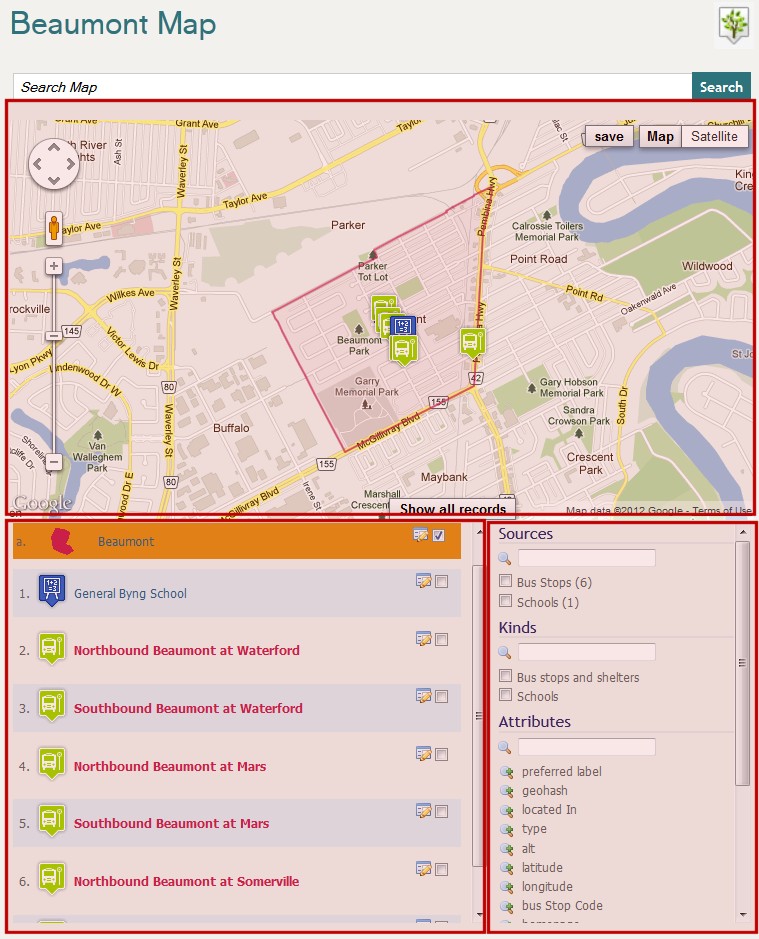
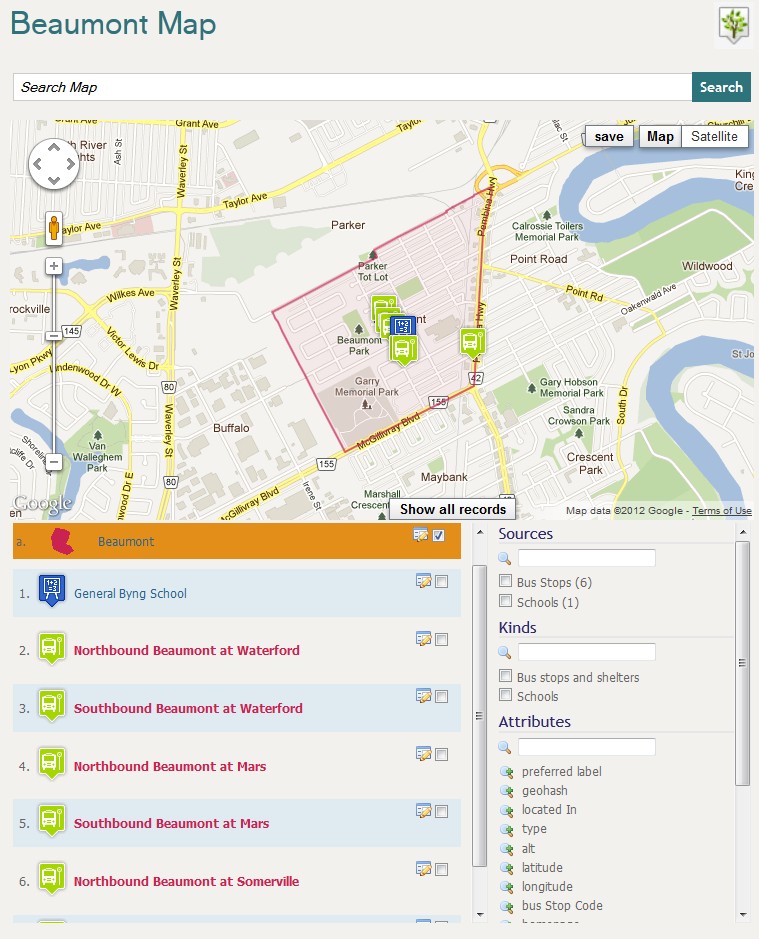
Here is an example for sWebMap when it first comes up, using an example for the “Beaumont neighborhood”:
It is possible to set pre-selected items for any map display. That was done in this case, which shows the pre-selected items and region highlighted on the map and in the records listing (lower left below map).
The basic layout of the map has its main search options at the top, followed by the map itself and then two panels underneath:
The left-hand panel underneath the map presents the results listing. The right-hand panel presents the various filter options by which these results are generated. The filter options consist of:
- Sources – the datasets available to the instance
- Kinds – the kinds or types of data (owl:Classes or rdf:types) contained within those datasets, and
- Attributes – the specific attributes and their values for those kinds or sources.
As selections are made in sources or kinds, the subsequent choices narrow.
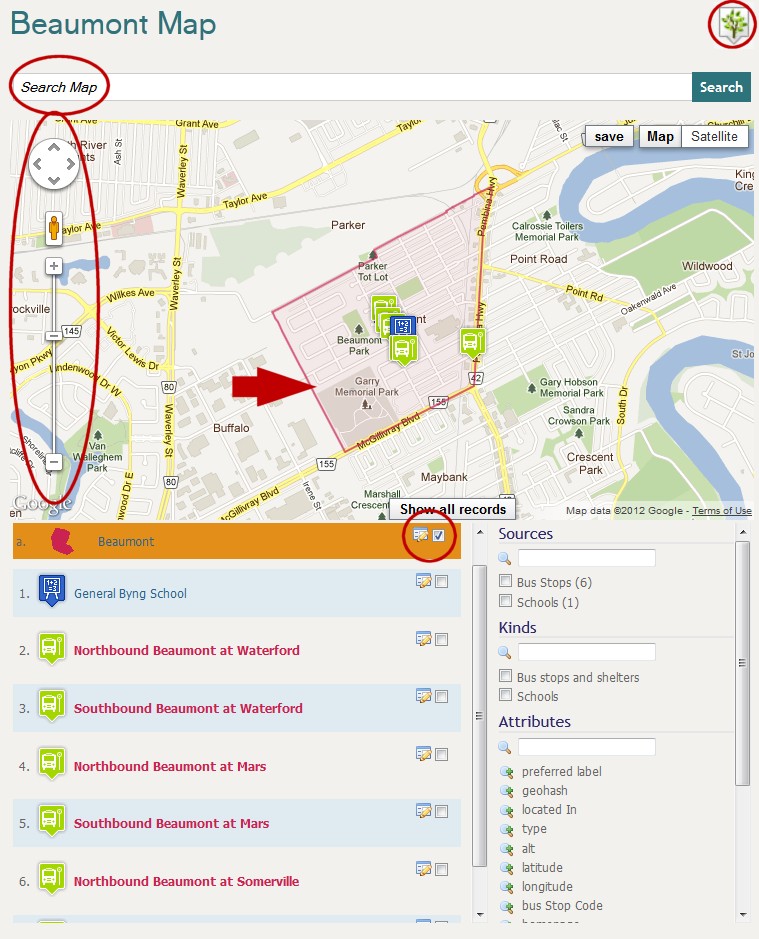
The layout below shows the key controls available on the sWebMap:
You can go directly to an affiliated page by clicking the upper right icon. This area often shows a help button or other guide. The search box below that enables you to search for any available data in the system. If there is information that can be mapped AND which occurs within the viewport of the current map size, those results will appear as one of three geographic feature types on the map:
- Markers, which can be configured with differing icons for specific types or kinds of data
- Polylines, such as highways or bus routes, or
- Polygons, which enclose specific regions on the map through a series of drawn points in a closed area.
At the map’s right is the standard map control that allows you to scroll the map area or zoom. Like regular Google maps, you can zoom (+ or – keys, or middle wheel on mouse) or navigate (arrow direction keys, or left mouse down and move) the map.
Current records are shown below the map. Specific records may be selected with its checkbox; this keeps them persistent on the map and in the record listing no matter what the active filter conditions may be. (You may also see a little drawing icon [ ], which presents an attribute report — similar to a Wikipedia ‘infobox‘ — for the current record). You can see in this case that the selected record also corresponds to a region (polygon) shape on the map.
sWebMap Views, Layers and Layouts
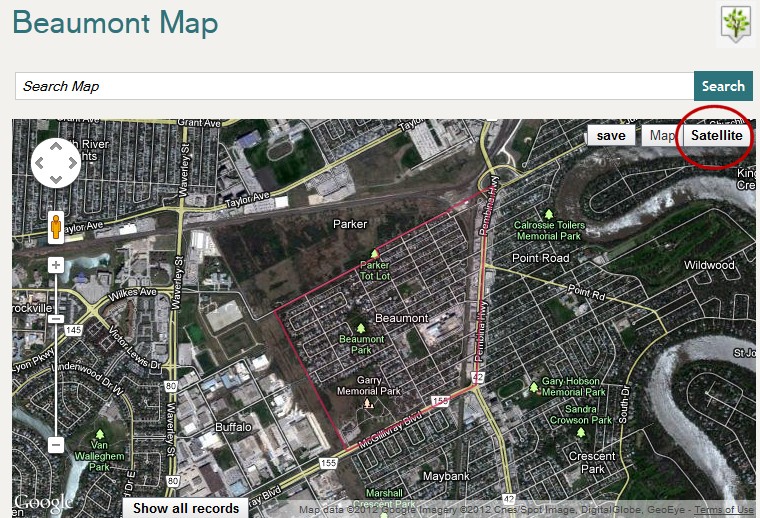
In the map area itself, it is possible to also get different map views by selecting one of the upper right choices. In this case, we can see a satellite view (or “layer”):
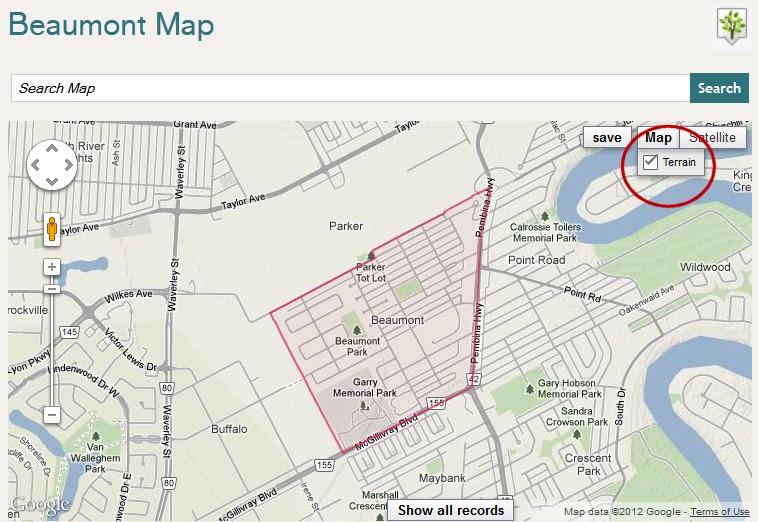
Or, we can choose to see a terrain layer:
Or there may optionally be other layers or views available in this same section.
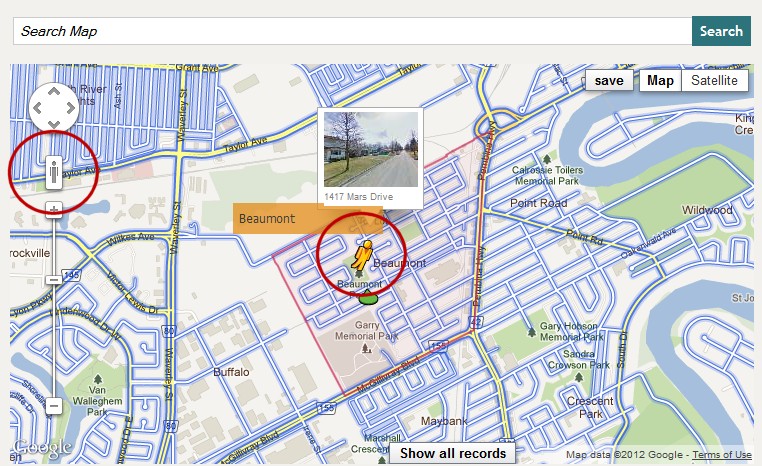
Another option that appears on the map is the ability to get a street view of the map. That is done by grabbing the person icon at the map left and dragging it to where you are interested within the map viewport. That also causes the street portion to be highlighted, with street view photos displayed (if they exist for that location):
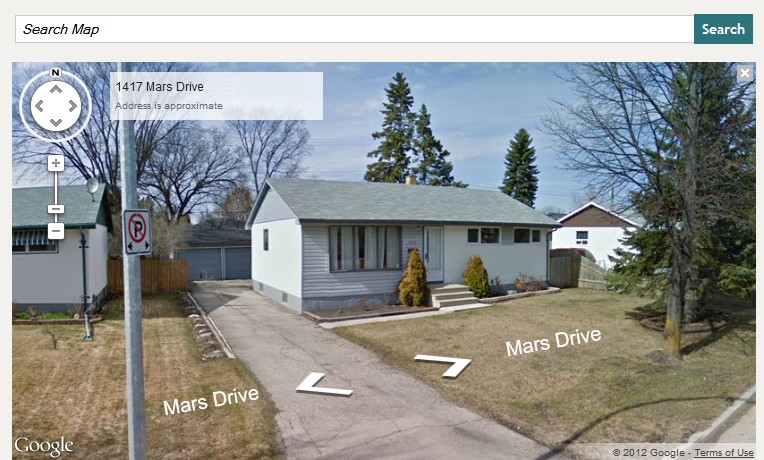
By clicking the person icon again, you then shift into walking view:
Via the mouse, you can now navigate up and down these streets and change perspective to get a visual feel for the area.
Multi-map View
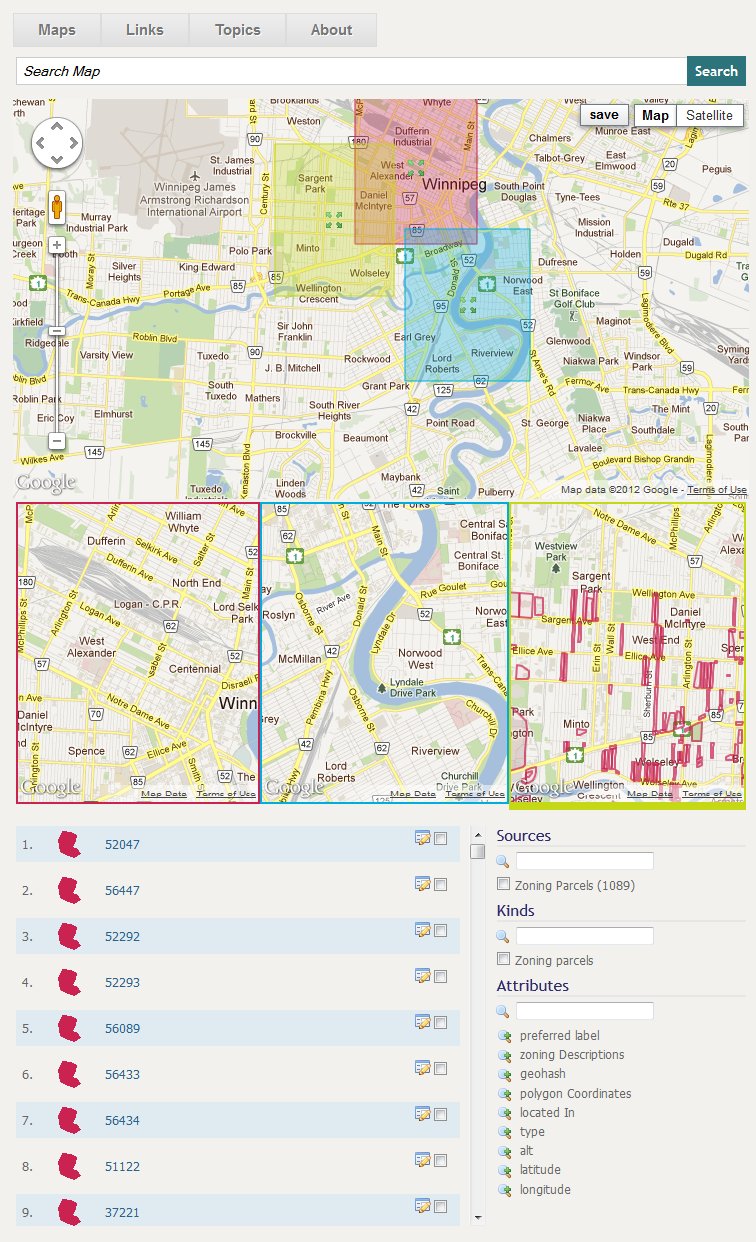
Another option you may invoke is the multi-map view of the sWebMap. In this case, the map viewing area expands to include three sub-maps under the main map area. Each sub-map is color-coded and shown as a rectangle on the main map. (This particular example is displaying assessment parcels for the sample instance.) These rectangles can be moved on the main map, in which case their sub-map displays also move:
You must re-size using the sub-map (which then causes the rectangle size to change on the main map). You may also pan the sub-maps (which then causes the rectangle to move on the main map). The results list at the lower left is determined by which of the three sub-maps is selected (as indicated by the heavier bottom border).
Searching and Filter Selections
There are two ways to get filter selection details for your current map: Show All Records or Search.
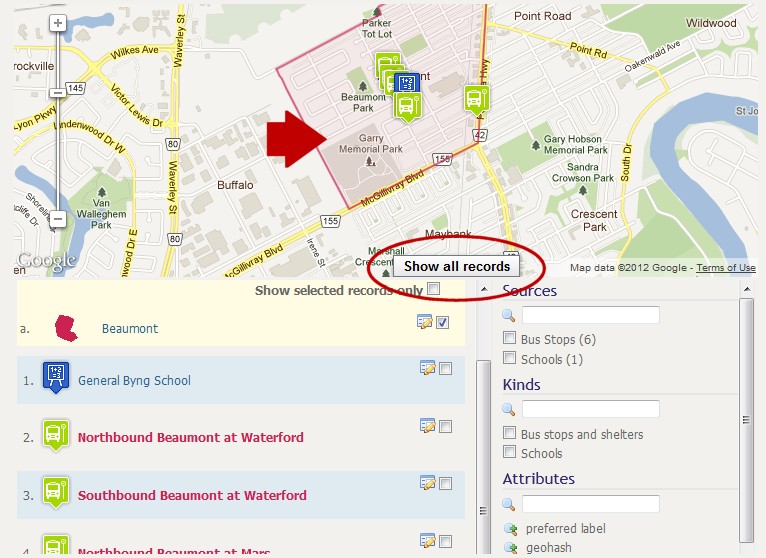
In the first case, we pick the Show All Records option at the bottom of the map view, which then brings up the detailed filter selections in the lower-right panel:
Here are some tips for using the left-hand records listing:
- If there are more than 10 records, pagination appears at the bottom of the listing
- Each record is denoted by an icon for the kind of thing it is (bus stops v schools v golf courses, for example)
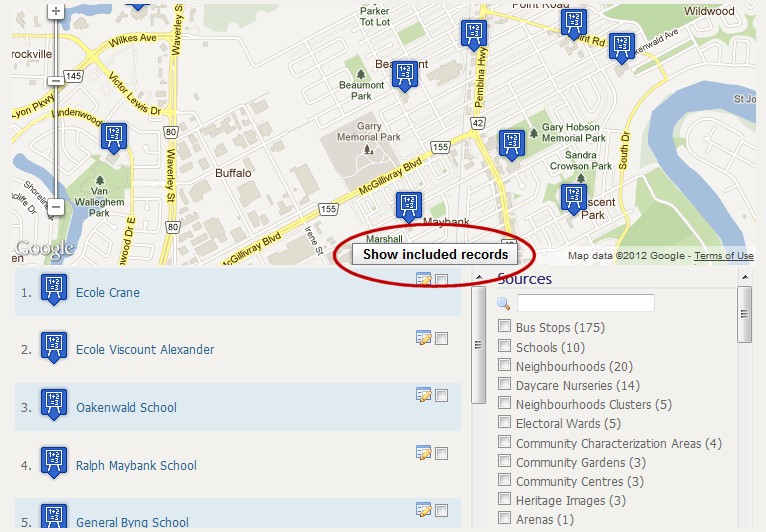
- If we mouse over a given record in the listing, its marker icon on the map bounces to show where it resides
- To the right of each record listing, the checkbox indicates whether you want the record to be maintained persistently. If you check it, the icon on the map changes color, the record is promoted to the top of the list where it becomes sticky and is given an alphabetic sequence. Unchecking this box undoes all of these changes
- To the right of each record listing is also the view record [
 ] icon; clicking it shows the raw attribute data for that record.
The records that actually appear on this listing are based on the records scope or Search (see below) conditions, as altered by the filter settings on the right-hand listing under the sWebMap. For example, if we now remove the neighborhood record as being persistent and Show included records we now get items across the entire map viewport:
Search works in a similar fashion, in that it invokes the filter display with the same left- and right-hand listings appear under the sWebMap, only now only for those records that met the search conditions. (The allowable search syntax is that for Lucene.) Here is the result of a search, in this case for “school”:
As shown above, the right-hand panel is split into three sections: Sources (or datasets), Kinds (that is, similar types of things, such as bus stops v schools v golf courses), and Attributes (that is, characteristics for these various types of things). All selection possibilities are supported by auto-select.
Sources and Kinds are selected via checkbox. (The default state when none are checked is to show all.) As more of these items are selected, the records listing in the left-hand panel gets smaller. Also, the counts of available items [as shown by the (XX) number at the end of each item] are also changed as filters are added or subtracted by adding or removing checkboxes.
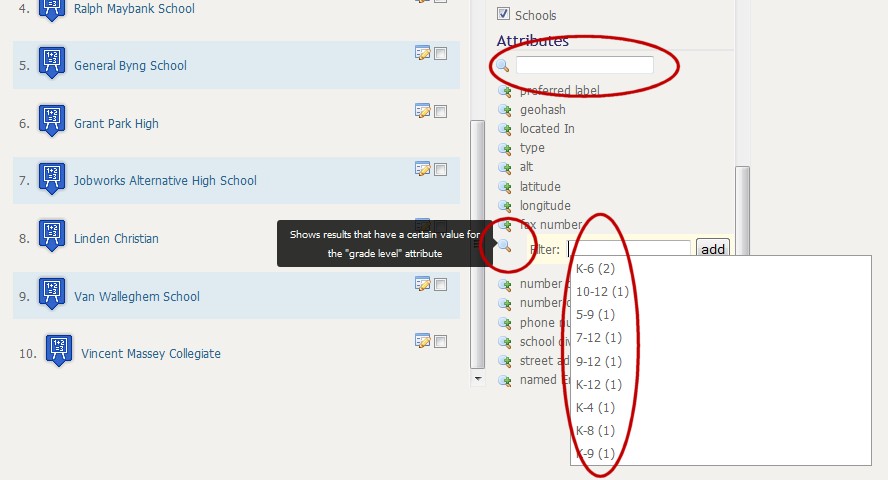
Applying filters to Attributes works a little differently. Attributes filters are selected by selecting the magnifier plus [ ] icon, which then brings up a filter selection at the top of the listing underneath the Attributes header.
The specific values and their counts (for the current selection population) is then shown; you may pick one or more items. Once done, you may pick another attribute to add to the filter list, and continue the filtering process.
Saving and Sharing Your Filters
sWebMaps have a useful way to save and share their active filter selections. At any point as you work with a sWebMap, you can save all of its current settings and configurations — viewport area, filter selections, and persistent records — via some simple steps.
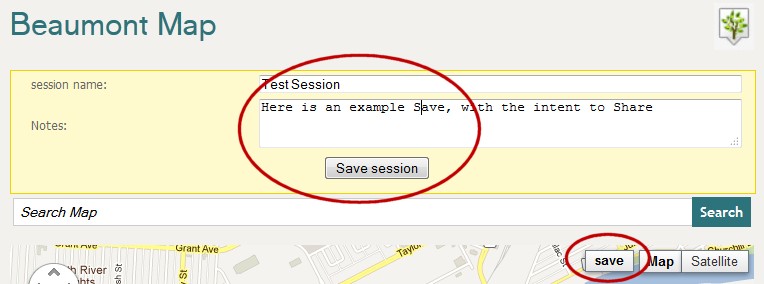
You initiate this functionality by choosing the save button at the upper right of the map panel:
When that option is invoked, it brings up a dialog where you are able to name the current session, and provide whatever explanatory notes you think might be helpful.
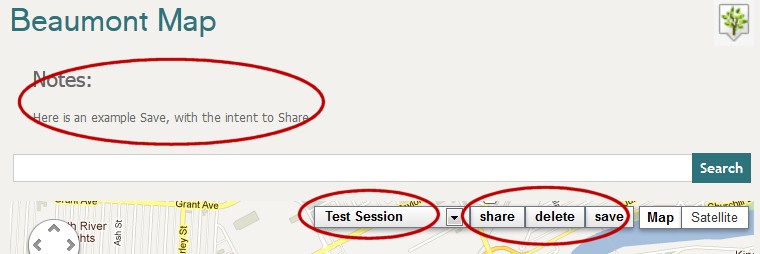
Once you have a saved session, you will then see a new control at the upper right of your map panel. This control is how you load any of your previously saved sessions:
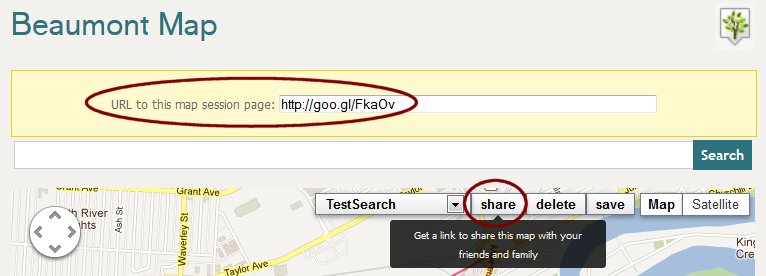
Further, once you load a session, still further options are presented to you that enables you to either delete or share that session:
If you choose to share a session, a shortened URI is generated automatically for you:
If you then provide that URI link to another user, that user can then click on that link and see the map in the exact same state — viewport area, filter selections, and persistent records — as you initially saved. If the recipient then saves this session, it will now also be available persistently for his or her local use and changes.


 views
views