Huynh Adds to His Winning Series of Lightweight Structured Data Tools
David Huynh, a Ph.D. grad student developer par excellence from MIT’s Simile program, has just announced the beta availability of Potluck. Potluck allows casual users to mashup data on the Web using direct manipulation and simultaneous editing techniques, generally (but not exclusively!) based on Exhibit-powered pages.
Besides Potluck and Exhibit, David has also been the lead developer on such innovative Simile efforts as Piggy Bank, Timeline, Ajax, Babel, and Sifter, as well as a contributor to Longwell and Solvent. Each merits a look. Those familiar with these other projects will notice David’s distinct interface style in Potluck.
Taking Your First Bites
There is a helpful 6-min movie on Potluck that gives a basic overview of use and operation. I recommend you start here. Those who want more details can also read the Potluck paper in PDF, just accepted for presentation at ISWC 2007. And, after playing with the online demo, you can also download the beta source code directly from the Simile site.
Please note that Firefox is the browser of choice for this beta; Internet Explorer support is limited.
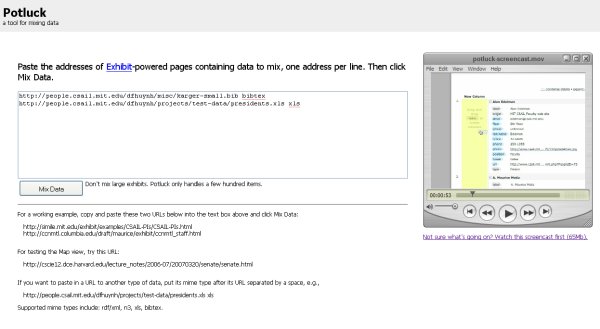
To invoke Potluck, you simply go to the demo page, enter two or more appropriate source URLs for mashup, and press Mix Data:
(You can also get to the movie from this page.)
Once the datasets are loaded, all fields from the respective sources are rendered as field tags. To combine different fields from different datasets, the respective field tags (color coded by dataset) to be matched are simply dragged to a new column. Differences in field value formats between datasets can be edited with an innovative approach to simultaneous group editing (see below). Once fields are aligned, they then may be assigned as browsing facets. The last step in working with the Potluck mashup is choosing either tabular or map views for the results display.
Potluck is designed to mashup existing Exhibit displays (JSON format), and is therefore lightweight in design. (Generally, Exhibit should be limited to about 500 data records or so per set.)
However, with the addition of the appropriate type name when specifying one of the sources to mash up, you can also use spreadsheet (xls), BibTeX, N3 or RDF/XML formats. The demo page contains a few sample data links. Additional sample data files for different mime types are (note entry using a space with type designator at end):
- http://people.csail.mit.edu/dfhuynh/projects/test-data/presidents.xls xls
- http://people.csail.mit.edu/dfhuynh/misc/karger-small.bib bibtex
- http://www.w3.org/People/Connolly/events/events-smart.rdf rdf/xml
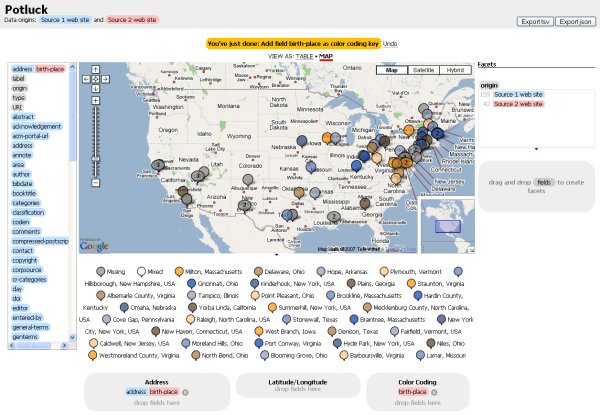
Besides the standard tabular display, you can also map results. For example, use the BibTeX example above and drop the “address” field into the first drop target area. Then, chose Map at the top of the display to get a mapping of conference locations.
In my own case, I mashed up this source and the xls sample on presidents, and then plotted out location in the US:
Given the capabilities in some of the other Simile tool sets, incorporating timelines or other views should be relatively straightforward.
Pragmatic Lessons and Cautions with Semantic Mashups
Different datasets name similar or identical things differently and characterize their data differently. You can’t combine data from different datasets without resolving these differences. These various heterogeneities — which by some counts can be 40 or so classes of possible differences — were tabulated in one of my recent structured Web posts.
There has been considerable discussion in recent days on various ontology and semantic Web mailing lists about how some practices may solve or not questions of semantic matching. Some express sentiments that proper use of URIs, use of similar namespaces and use of some predicates like owl:sameAs may largely resolve these matters.
However, discussion in David’s ISWC 2007 paper and use of the Potluck demo readily show the pragmatic issues in such matches. Section 2 in the paper presents a readable scenario for real-world challenges in how a historian without programming skills would go about matching and merging data. Despite best practices, and even if all are pursued, actually “meshing” data together from different sources requires judgment and reconciliation. One of the great values of Potluck is as a heuristic and learning tool for making prominent these real-world semantic heterogeneities.
The complementary value of Potluck is its innovative interface design for actually doing such meshing. Potluck is a case argument that pragmatic solutions and designs only come about by just “doing it.”
Easy, Simultaneous Editing
(Note: Though a diagram illustrates some points below, it is no substitute for using Potluck yourself.)
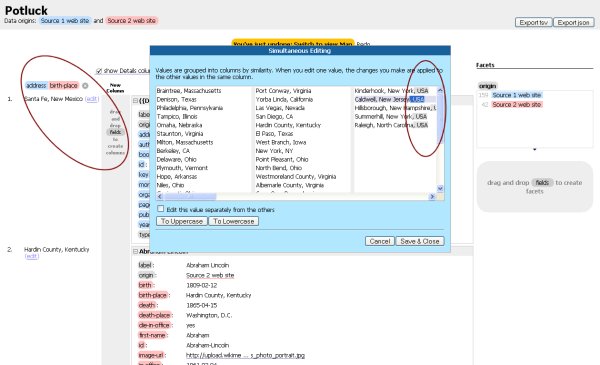
Potluck uses a simple drag-and-drop model for matching fields from different datasets. In the left-hand oval in the diagram below, the user clicks on a field name in a record, drags it to a column, and then repeats that process for matching fields in a records of a different dataset. In the instance below, we are matching the field names of “address” and “birth-place”, which then also get color coded by dataset:
This process can be repeated for multiple field matches. The merged fields themselves can be subsequently dragged-and-dropped to new columns for renaming or still further merging.
The core innovation at the heart of Potluck is what happens next. By clicking on Edit for any record in a merged field, the dialog shown above pops up. This dialog supports simultaneous group editing based on LAPIS, another MIT tool for editing text with lightweight structure developed by Ron Miller and team.
As implemented in JavaScript in Potluck, LAPIS first groups data items by similar patterned structure; this initial grouping is what determines the various columns in the above display. Then, when the user highlights any pattern in a column, these are repeated (see same cursors and shading in the right-hand oval) for all entries in the column. They can then be deleted (for pruning, in this case removing ‘USA’), or cut-and-pasted (such as for changing first- and last-name order) for all items in a column. (Single item editing is obviously also an option.)
The first grouping mostly ensures that data formatted differently in different datasets are displayed in their own column. One data form is used for the merged field, and all other columns are group edited to conform. The actual patterns are based on runs of digits, letters, white spaces, or individual punctuation marks and symbols, which are then “greedy” aligned for first the column grouping and then for cursor alignment within columns on highlighted patterns.
The net result is very fast and efficient bulk editing. This approach points the way to more complicated pattern matches and other substitution possibilities (such as unit changes or date and time formats).
Rough Spots and A Hope
I was tempted to award Potluck one of AI3‘s Jewels and Doubloons Awards, but the tool is still premature with rough spots and gaps. For examples, IE and browser support needs to be improved; it would be helpful to be able to delete a record from inclusion in the mashup. (Sometimes only after combining is it clear some records don’t belong together.)
One big issue is that the system does not yet work well with all external sites. For example, my own Sweet Tools Exhibit refused to load and the one from the European Space Agency’s Advanced Concept Team caused JavaScript errors.
Another big issue is that whole classes of functionality, such as writing out combined results or more data view options, are missing.
Of course, this code is not claimed to be commercial grade. What is most important is its pathbreaking approach to semantic mashups (actually, what some others such as Jonathan Lathem have called ‘smashups’) and interfaces and approaches to group editing techniques.
I hope that others pick up on this tool in earnest. David Huynh is himself getting close to completing his degree and may not have much time in the foreseeable future to continue Potluck development. Besides Potluck’s potential to evolve into a real production-grade utility, I think its potential to act as a learning test bed for new UI approaches and techniques for resolving semantic heterogeneities is even greater.


