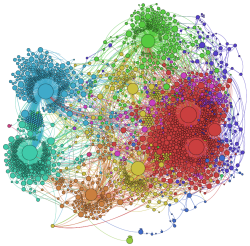
 Visualization + Analysis Pushes Aside Cytoscape
Though I never intended it, some posts of mine from a few years back dealing with 26 tools for large-scale graph visualization have been some of the most popular on this site. Indeed, my recommendation for Cytoscape for viewing large-scale graphs ranks within the top 5 posts all time on this site.
When that analysis was done in January 2008 my company was in the midst of needing to process the large UMBEL vocabulary, which now consists of 28,000 concepts. Like anything else, need drives research and demand, and after reviewing many graphing programs, we chose Cytoscape, then provided some ongoing guidelines in its use for semantic Web purposes. We have continued to use it productively in the intervening years.
Like for any tool, one reviews and picks the best at the time of need. Most recently, however, with growing customer usage of large ontologies and the development of our own structOntology editing and managing framework, we have begun to butt up against the limitations of large-scale graph and network analysis. With this post, we announce our new favorite tool for semantic Web network and graph analysis — Gephi — and explain its use and showcase a current example.
The Cytoscape Baseline and Limitations
Three and one-half years ago when I first wrote about Cytoscape, it was at version 2.5. Today, it is at version 2.8, and many aspects have seen improvement (including its Web site). However, in other respects, development has slowed. For example, version 3.x was first discussed more than three years ago; it is still not available today.
Though the system is open source, Cytoscape has also largely been developed with external grant funds. Like other similarly funded projects, once and when grant funds slow, development slows as well. While there has clearly been an active community behind Cytoscape, it is beginning to feel tired and a bit long in the tooth. From a semantic Web standpoint, some of the limitations of the current Cytoscape include:
- Difficult conversion of existing ontologies — Cytoscape requires creating a CSV input; there was an earlier RDFscape plug-in that held great promise to bridge the software into the RDF and semantic Web sphere, but it has not remained active
- Network analysis — one of the early and valuable generalized network analysis plug-ins was NetworkAnalyzer; however, that component has not seen active development in three years, and dynamic new generalized modules suitable for social network analysis (SNA) and small-world networks have not been apparent
- Slow performance and too-frequent crashes — Cytoscape has always had a quirky interface and frequent crashes; later versions are a bit more stable, but usability remains a challenge
- Largely supported by the biomedical community — from the beginning, Cytoscape was a project of the biomedical community. Most plug-ins still pertain to that space. Because of support for OBO (Open Biomedical and Biological Ontologies) formats and a lack of uptake by the broader semantic Web community, RDF- and OWL-based development has been keenly lacking
- Aside from PDFs, poor ability to output large graphs in a viewable manner
- Limited layout support — and poor performance for many of those included with the standard package.
Undoubtedly, were we doing semantic technologies in the biomedical space, we might well develop our own plug-ins and contribute to the Cytoscape project to help overcome some of these limitations. But, because I am a tools geek (see my Sweet Tools listing with nearly 1000 semantic Web and -related tools), I decided to check out the current state of large-scale visualization tools and see if any had made progress on some of our outstanding objectives.
Choosing Gephi and Using It
There are three classes of graph tools in the semantic technology space:
- Ontology navigation and discovery, to which the Relation Browser and RelFinder are notable examples
- Ontology structure visualization (and sometimes editing), such as the GraphViz (OWLViz) or OntoGraf tools used in Protégé (or the nice FlexViz, again used by the OBO community), and
- Large-scale graph visualization in order to gain a complete picture and macro relationships in the ontology.
One could argue that the first two categories have received the most current development attention. But, I would also argue that the third class is one of the most critical: to understand where one is in a large knowledge space, much better larger-scale visualization and navigation tools are needed. Unfortunately, this third category is also the one that appears to be receiving the least development attention. (To be sure, large-scale graphs pose computational and performance challenges.)
In the nearly four years since my last major survey of 26 tools in this category, the new entrants appear quite limited. I’ve surely overlooked some, but the most notable are Gruff, NAViGaTOR, NetworkX and Gephi [1]. Gruff actually appears to belong most in Category #2; I could find no examples of graphs on the scale of thousands of nodes. NAViGaTOR is biomedical only. NetworkX has no direct semantic graph importing and — while apparently some RDF libraries can be used for manipulating imports — alternative workflows were too complex for me to tackle for initial evaluation. This leaves Gephi as the only potential new candidate.
From a clean Web site to well-designed intro tutorials, first impressions of Gephi are strongly positive. The real proof, of course, was getting it to perform against my real use case tests. For that, I used a “big” ontology for a current client that captures about 3000 different concepts and their relationships and more than 100 properties. What I recount here — from first installing the program and plug-ins and then setting up, analyzing, defining display parameters, and then publishing the results — took me less than a day from a totally cold start. The Gephi program and environment is surprisingly easy to learn, aided by some great tutorials and online info (see concluding section).
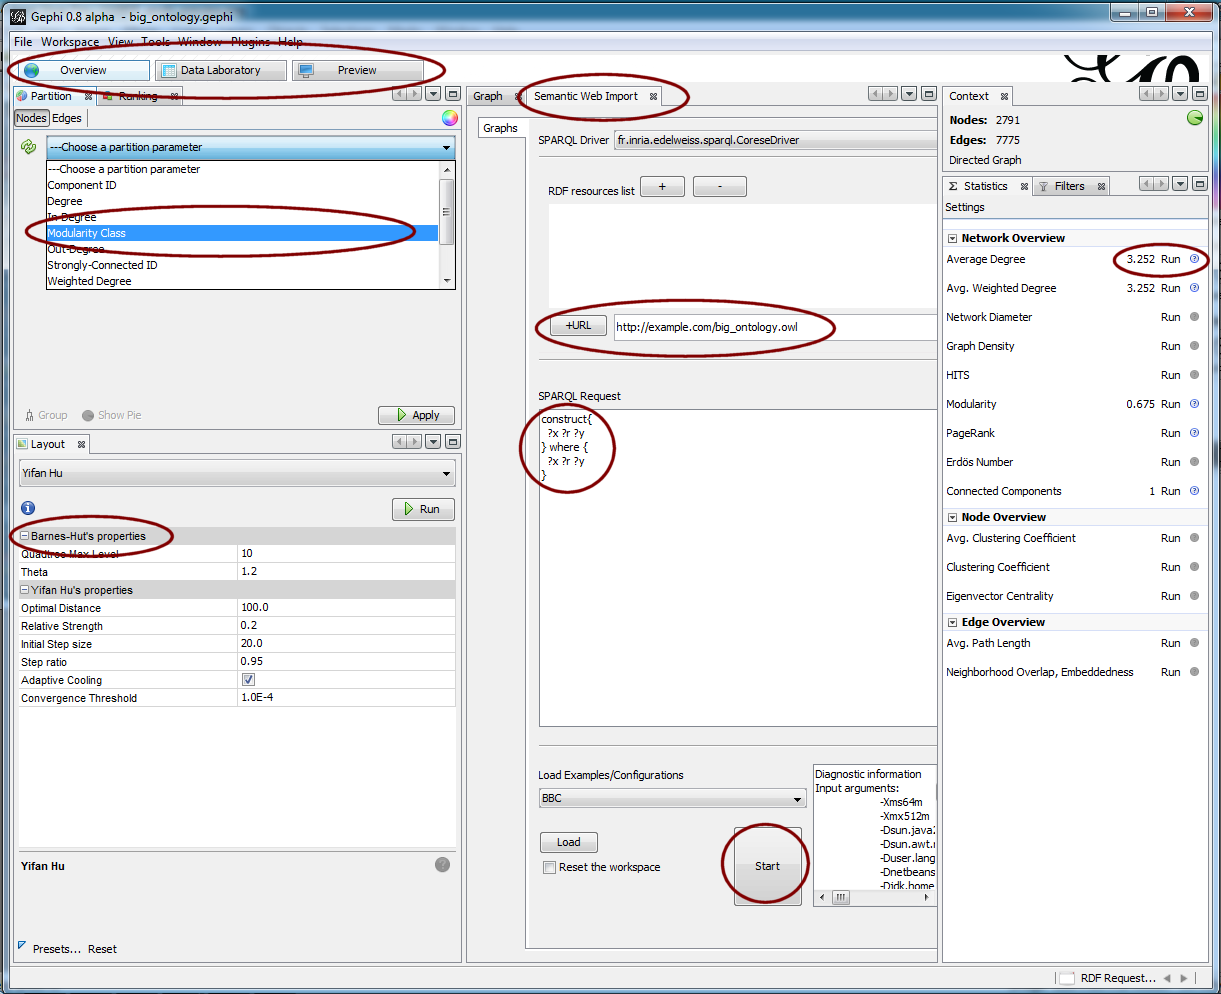
The critical enabler for being able to use Gephi for this source and for my purposes is the SemanticWebImport plug-in, recently developed by Fabien Gandon and his team at Inria as part of the Edelweiss project [2]. Once the plug-in is installed, you need only open up the SemanticWebImport tab, give it the URL of your source ontology, and pick the Start button (middle panel):
 Note the SemanticWebImport tool also has the ability (middle panel) to issue queries to a SPARQL endpoint, the results of which return a results graph (partial) from the source ontology. (This feature is not further discussed herein.) This ontology load and display capability worked without error for the five or six OWL 2 ontologies I initially tested against the system.
Once loaded, an ontology (graph) can be manipulated with a conventional IDE-like interface of tabs and views. In the right-hand panels above we are selecting various network analysis routines to run, in this case Average Degrees. Once one or more of these analysis options is run, we can use the results to then cluster or visualize the graph; the upper left panel shows highlighting the Modularity Class, which is how I did the community (clustering) analysis of our big test ontology. (When run you can also assign different colors to the cluster families.) I also did some filtering of extraneous nodes and properties at this stage and also instructed the system via the ranking analysis to show nodes with more link connections as larger than those nodes with fewer links.
At this juncture, you can also set the scale for varying such display options as linear or some power function. You can also select different graph layout options (lower left panel). There are many layout plug-in options for Gephi. The layout plugin called OpenOrd, for instance, is reported to be able to scale to millions of nodes.
At this point I played extensively with the combination of filters, analysis, clusters, partitions and rankings (as may be separately applied to nodes and edges) to: 1) begin to understand the gross structure and characteristics of the big graph; and 2) refine the ultimate look I wanted my published graph to have.
In our example, I ultimately chose the standard Yifan Hu layout in order to get the communities (clusters) to aggregate close to one another on the graph. I then applied the Parallel Force Atlas layout to organize the nodes and make the spacings more uniform. The parallel aspect of this force-based layout allows these intense calculations to run faster. The result of these two layouts in sequence is then what was used for the results displays.
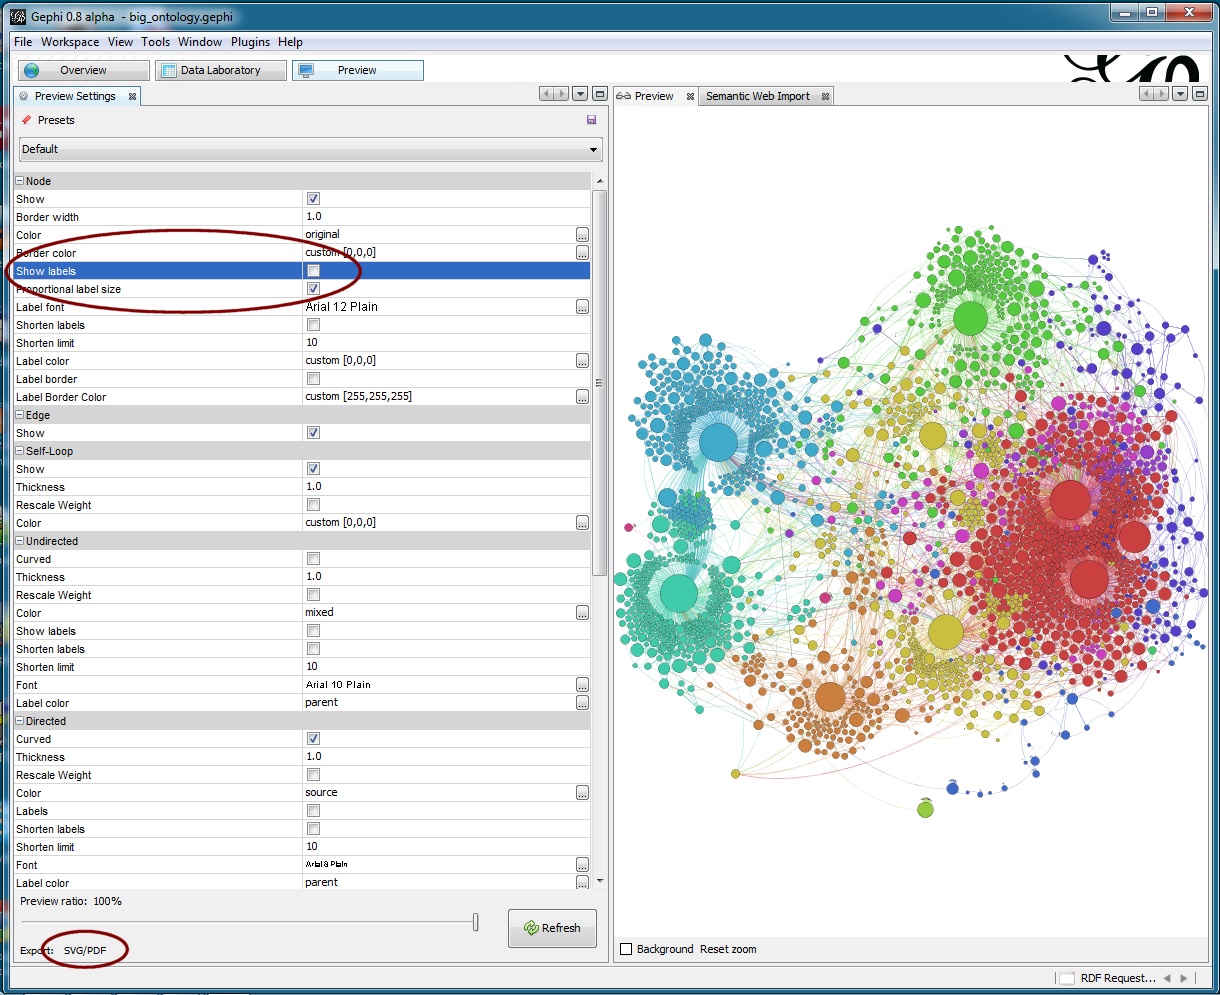
Upon completion of this analysis, I was ready to publish the graph. One of the best aspects of Gephi is its flexibility and control over outputs. Via the main Preview tab, I was able to do my final configurations for the published graph:
 The graph results from the earlier-worked out filters and clusters and colors are shown in the right-hand Preview pane. On the left-hand side, many aspects of the final display are set, such as labels on or off, font sizes, colors, etc. It is worth looking at the figure above in full size to see some of the options available.
Standard output options include either SVG (vector image) or PDFs, as shown at the lower left, with output size scaling via slider bar. Also, it is possible to do standard saves under a variety of file formats or to do targeted exports.
One really excellent publication option is to create a dynamically zoomable display using the Seadragon technology via a separate Seadragon Web Export plug-in. (However, because of cross-site scripting limitations due to security concerns, I only use that option for specific sites. See next section for the Zoom It option — based on Seadragon — to workaround that limitation.)
Outputs Speak for Themselves
I am very pleased with the advances in display and analysis provided by Gephi. Using the Zoom It alternative [3] to embedded Seadragon, we can see our big ontology example with:
- All 3000 nodes labeled, with connections shown (though you must must zoom to see) and
- When zooming (use scroll wheel or + icon) or panning (via mouse down moves), wait a couple of seconds to get the clearest image refresh:
Note: at standard resolution, if this graph were to be rendered in actual size, it would be larger than 7 feet by 7 feet square at full zoom !!!
To compare output options, you may also;
- Download a PDF of this big graph, OR
- Download an SVG (Inkscape readable version) of this big graph.
Still, Some Improvements Would be Welcomed
It is notable that Gephi still only versions itself as an “alpha”. There is already a robust user community with promise for much more technology to come.
As an alpha, Gephi is remarkably stable and well-developed. Though clearly useful as is, I measure the state of Gephi against my complete list of desired functionality, with these items still missing:
- Real-time and interactive navigation — the ability to move through the graph interactively and to issue queries and discover relationships
- Huge node numbers — perhaps the OpenOrd plug-in somewhat addresses this need. We will be testing Gephi against UMBEL, which is an order of magnitude larger than our test big ontology
- More node and edge control — Cytoscape still retains the advantage in the degree to which nodes and edges can be graphically styled
- Full round-tripping — being able to use Gephi in an edit mode would be fantastic; the edit functionality is fairly straightforward, but the ability to round-trip in appropriate formats (OWL, RDF or otherwise) may be the greater sticking point.
Ultimately, of course, as I explained in an earlier presentation on a Normative Landscape for Ontology Tools, we would like to see a full-blown graphical program tie in directly with the OWL API. Some initial attempts toward that have been made with the non-Gephi GLOW visualization approach, but it is still in very early phases with ongoing commitments unknown. Optimally, it would be great to see a Gephi plug-in that ties directly to the OWL API.
In any event, while perhaps Cytoscape development has stalled a bit for semantic technology purposes, Gephi and its SemanticWebImport plug-in have come roaring into the lead. This is a fine toolset that promises usefulness for many years to come.
Some Further Gephi Links
To learn more about Gephi, also see the:
- Terrific introductory tutorials on quick start, visualization and layouts
- Fast videos on the use of the SemanticWebImport plug-in for DBpedia and BBC programs
- Gephi community wiki.
Also, for future developments across the graph visualization spectrum, check out the Wikipedia general visualization tools listing on a periodic basis.
- Use Gephi’s SVG export option
- Open the SVG in Inkscape
- Expand the size of the diagram as needed (with locked dimensions to prevent distortion)
- Save As a PNG
- Go to Zoom It and submit the image file
- Choose the embed function, and
- Embed the link provided, which is what is shown above.


I would like to know what kind of analysis can be perfomed on RDF data, once imported and converted it into graph format for visualization, i would like to know what centrality measures will be telling actually about data like degree,betweeness etc
but an excellent tutorial, would like it more , if u can tell us how to import dataset from local harddrive which is in RDF format
Hi everyone
I would like to know the limitation of Gephi interms of number of nodes and edges it can handle.I have around 6.6 million nodes and around 30 million edges in my graph.Is there a way to visualize this huge network graph on Gephi or any other visualization tools as such?